


Custom AirNow Maps - Putting It All Together
There are many situations where these basic, simple customizations are all you need. But there are likely more situations where these don’t quite get you what you need. Using the methods described above, you can combine variables to get more than one item on your map. For example, say you wanted to show a national forecast map with only PM 2.5 monitors and a PM 2.5 contour on a map for southern California.
Using the methods described in Defining Your Map Area, the xmin, ymin, xmax, and ymax values for the selected area of southern California are:
- xmin = -13423000
- ymin = 3713000
- xmax = -12367000
- ymax = 4323000
If we just wanted that location, we would create the following link:
https://gispub.epa.gov/airnow/index.html?xmin=-13423000&ymin=3713000&xmax=-12367000&ymax=4323000
Now, plugging those links into a browser would give us the correct location. But we also want to show: 1) the Current tab, 2) the PM2.5 monitors, and 3) the PM2.5 contours.
If you look at the sections on Changing the Tabs, plus the section Changing the Layers and Contours, you’ll see we can set each of those values:
- The Current tab is set by tab=0
- The PM2.5 monitors layer is set by mlayer=pm25
- The PM2.5 contour layer is set by clayer=pm25
As we did with the map area variables (xmin, ymin, xmax, ymax), we string multiple variables together by adding a “&” between them—for as many variables as we need.
So, we take our custom location map address for southern California: https://gispub.epa.gov/airnow/index.html?xmin=-13423000&ymin=3713000&xmax=-12367000&ymax=4323000
We add the tab variable for the Current tab (tab=0):
We then add both the monitor and the contour variables (mlayer=pm25 and clayer=pm25):
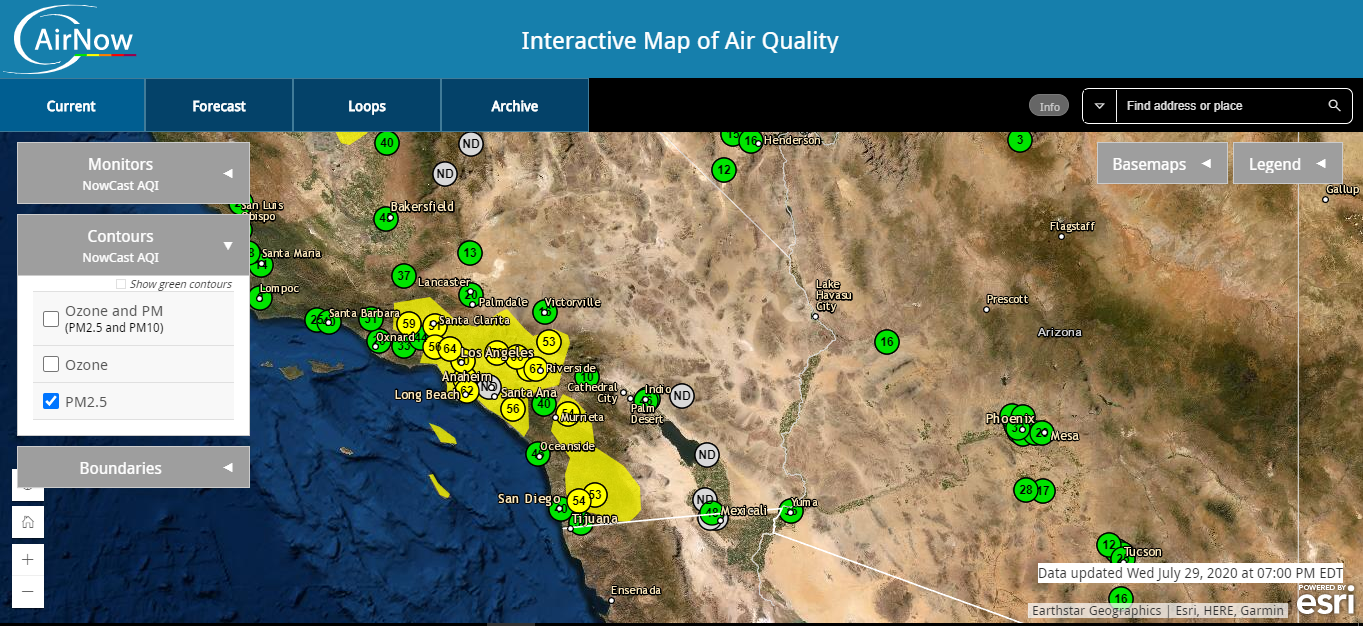
We have now assembled a web address that generates the map we originally wanted—a map of a specific area of southern California displaying PM2.5 monitors and contours on the Current tab.
These methods can be used to generate custom maps for other tabs as well, such as the Forecast or Loops tabs.