


Using AirNow During Wildfires
Which AirNow product should I use during smoke events?
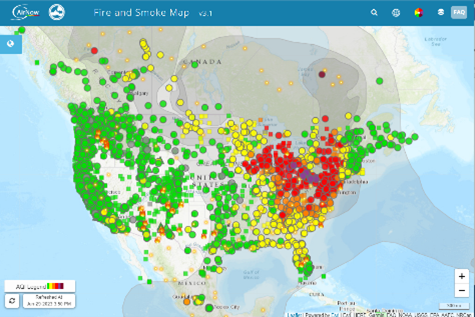
Use the AirNow Fire and Smoke Map when wildfire smoke is affecting your air quality.
This map, which EPA produces in partnership with the U.S. Forest Service, includes the most comprehensive information about wildfire smoke and air quality. You can view the map on the web, or you can see it in the AirNow app by clicking the smoke icon on the bottom right of the screen.
The Fire and Smoke Map shows:
- Your air quality from fine particle pollution (PM2.5), which is the key pollutant in smoke;
- Steps you can take to reduce your smoke exposure;
- Information about whether air quality is getting better or worse;
- Smoke plumes;
- Fire locations; and
- Smoke forecast outlooks (where available).
To see the additional information for your location, click or tap one of the colored icons near you.
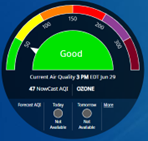
Why is the AirNow dial information sometimes different than the Fire and Smoke Map and the Interactive Map?
The information on the "dial" comes from monitors selected by AirNow's partners at state, local and tribal air agencies. If there is no PM2.5 monitor in the area, or if levels of other pollutants are higher than PM2.5 levels, the dial may not show how smoke is affecting your air quality. In this example, the dial shows ozone. Visit the Fire and Smoke Map to see how wildfire smoke is affecting the air where you are.
The Interactive Map and the Fire and Smoke Map don't look the same. Why?
The AirNow Fire and Smoke Map includes crowdsourced data from thousands of air quality sensors, in addition to data from thousands of permanent PM2.5 monitors that report to AirNow, along with temporary PM2.5 monitors. The monitors are operated by federal, state, local and tribal experts. This map shows air quality by specific location, along with fire locations and smoke plumes.
The interactive map shows air quality from the permanent monitors that report to AirNow. You can choose to see air quality at monitors for ozone, PM2.5 and/or PM10. You also have the option in the interactive map to view air quality "contours," which are developed using data from multiple monitors in an area. You can see which ones are included by turning on the monitor layer on the map.
When wildfire smoke is affecting your air quality, we recommend you use the Fire and Smoke Map.